
Creating Math Images in Google Drawing
I LOVE GOOGLE DRAWING. If you’ve been around here for awhile, you know how much I use Drawing or the Drawing features in slides. This post is dedicated to how I use Google Drawing to create my own images for activities and assessments.
Google Drawing will download as a transparent .PNG image.
It’s vector based, so if you make a large image it will scale without much
degradation of the image. I once create panels for a tri-fold display board,
printed them and glued them to the board. The images were crisp and looked
professional.
Here is a tutorial on some basic features of Google Drawing.
These are just a few of the images you can make with Google Drawing.
This slideshow requires JavaScript.
These are just a few of the VERY MANY images I’ve created in Google Drawing.


This tool will allow you to create your own AWESOME looking content. Enjoy

Equations of Circles- Distance Learning Style
This is one of those activities I do in my classroom every year after we learn about equations of circles. Well… most of my kiddos don’t have a compass at home so I came up with a Google Slides way to do this. I even included an animation on the 2nd page to show students how to make the circles and change them to transparent.
Hope this makes your life a little easier.
Stay safe and stay sane!


Fly Swatter, Parabolas, & Math Snaps
Key features of parabolas are important to understand the why behind quadratic graphs. It seems intuitive, and it is provided an image, but often the situation is represented as a graph with only words to guide students. My students can graph them but seem to struggle with where things are on the graph. We approached quadratics much differently this year, using only Desmos and graphing calculators to graph. We started with an idea from a colleague at another high school in my district. She uses fly swatters on day one to review key features of a parabola. This is not in the context of a situation but a good place to start. Student LOVED this activity.

This is played relay style (picture was taken on pajama day for homecoming, hence the jammies) and students run up and smack the parabola on the key feature selected.

I also gave an exit ticket in Desmos activity builder to see where we still needed to remediate. I really liked this one because it was open-ended. They moved the parabola around to meet each requirement.

I’ve included the link to the Desmos activity if you would like to use it as well.
Lastly, we worked with real situations. I gave them an Angry Birds picture and had them label, with their elbow partner, initial height, maximum height, time to max height, and time to the ground. It went pretty well and they got everything but initial height, which led to great discussions.
Our last activity was giving them a situation with an equation, they graphed it in Desmos and used their graph to make #mathsnaps. Bitmoji has updated so it wasn’t as easy to use since the beginning of the year (sad face). Students must now create an account on their app (iOS or Android) then link that to the Chrome extension. For students who didn’t have access to the app, I provided a link to clipart and emojis they could use. Here are a few of the math snaps I received this year.


This is without feedback so some of the information isn’t correct. We’ll be conferencing about it soon.
We learn from mistakes and some of mine will have some learning opportunities. YES!
How to draw a straight line in Google Slides
If you are using Google Slides, you may be having some trouble finding how to insert a line. Once you have figured out how to insert it, getting it to be also straight can be frustrating. Follow these easy steps to get it done.
Go to menu bar and select line.
 Line
option on the main menu
This site has a companion YouTube channel that has pretty much, well almost exactly, the same content. If you like this, you’ll like that.
Now, here’s where the real trick comes in. If you want to draw a line, go ahead. But, if you want to draw a straight line, hold down the shift key while you draw! There it is, a straight line.
Leave a Reply Cancel Reply
Google Sheets – Learn the Basics

How to draw on google slides
This morning, as I was looking over my upcoming lessons on analyzing webs I found out that the app I used to create drag and drop assignments is no more. Since before we get deeper into what happens in a food web when the population of an organism decreases or increases I need to be sure that my students are able to track the different food chains within a web, and we have been struggling with what is known in my classroom as "the arrows mean something", this was not a step I was willing to simply forgo. So I turned to the trusty internet for something already made. As I was inputting different search parameters I stumbled upon Matt Miller's "Creating moveable digital activities with Google Drawings + Slides". I watched the first part and, being a Google Drawing fan I went ahead and created my drawing, stacking multiples of the same text boxes as needed by simply copy/pasting them on top of each other and placing them as a stack on top of an "empty" box.

I felt rather pleased with myself and called my daughter to try it out. Dutifully she did, and immediately two super important things became evident:
1. I needed to be able to lock the background
After another round of searching and watching Matt's whole video, I found out that while you cannot lock the background on Google Drawing, you can set an image as a background on Google Slides.
Instead of adding them as text boxes, I created the text and used the snipping tool to create them as images. While they can still be deleted as a "block" the content cannot be modified.
I am sharing the student template to give you an idea of what you can do.
I then started thinking, what else could we do with this? I love the idea of the drag and drop but also wanted this to be a little more challenging. Inspiration struck as I moved on to a different grade level, where I decided that students could use the traditional labeling assignment as a drag and drop that leads to a presentation. Using the same technique as before, but adding links to blank slides students could do more than just a simple labeling assignment.
For example, in this assignment where students will be asked to label a plant and an animal cell and use that as a springboard to create a presentation detailing organelle functions.

What do you think? What other uses of the drag and drop do you see yourself creating?
Use draw.io diagrams in Google Docs
Diagrams are powerful – they make text easier to understand, and you are more likely to remember information when it’s presented in a diagram. Plus, they make your documents and presentations look much more professional.
Companies are increasingly switching to G Suite and individuals are taking advantage of Google’s free cloud-based office software and file storage platform.
With the free draw.io add-ons for Google Docs, you can easily add your draw.io diagrams as images to your documents and presentations, without having to export an image from draw.io and paste it into your document manually each time you change your diagram. Now, whenever your diagrams are updated, you can refresh them in your document and it will automatically regenerate the diagram image with the updated diagram. This works really well when you store your diagrams in Google Drive!
Install the draw.io add-on
1. First, open or create a new document. In the menu, click Add-ons then Get add-ons.

2. Search for draw.io, then click on the + Free button. Google may ask you to log into your account.

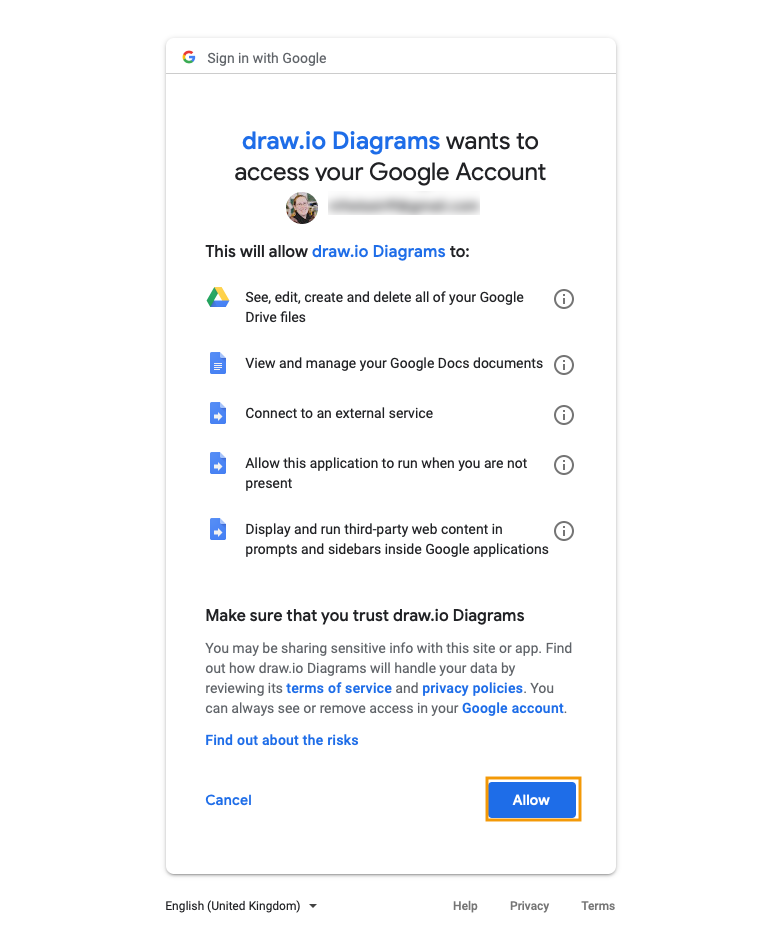
3. Finally, click on Allow to give the draw.io add-on permission to access your Google Account so it can see your files and import diagrams.
You’ll now be able to insert your draw.io diagrams into your documents.
Your diagram data is private and secure when you use the draw.io add-on in Google’s software. If you save your diagrams to Google Drive, all data, including the diagram file and your documents stay within your Google account.
Insert a diagram into a Google Doc
- Select Add-ons > Draw.io Diagrams > Insert Diagrams from the menu.
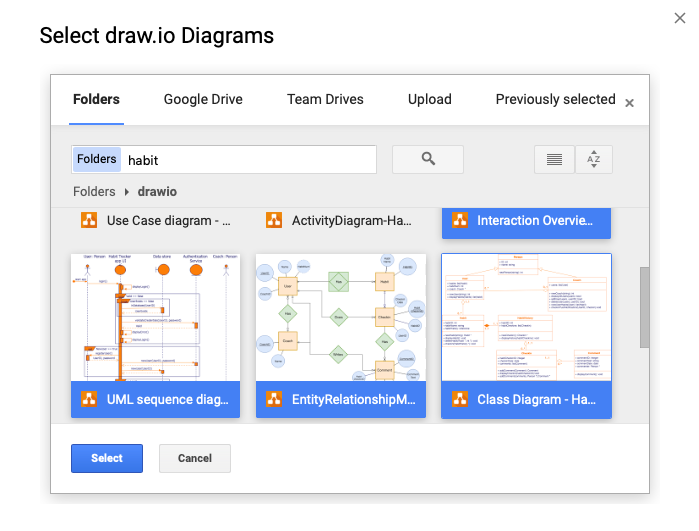
- Navigate to where your diagram is stored, click on it, then click Select.
- Set the display options for your diagram within your document:
- Choose which Page of your diagram to insert into your document if your diagram has multiple pages. You can only add one diagram page each time you insert a diagram.
- If you want to include a high quality image (better for print, but this may slow Google Docs down), select the High Resolution checkbox.
- Click Insert and your diagram will be added to the page.
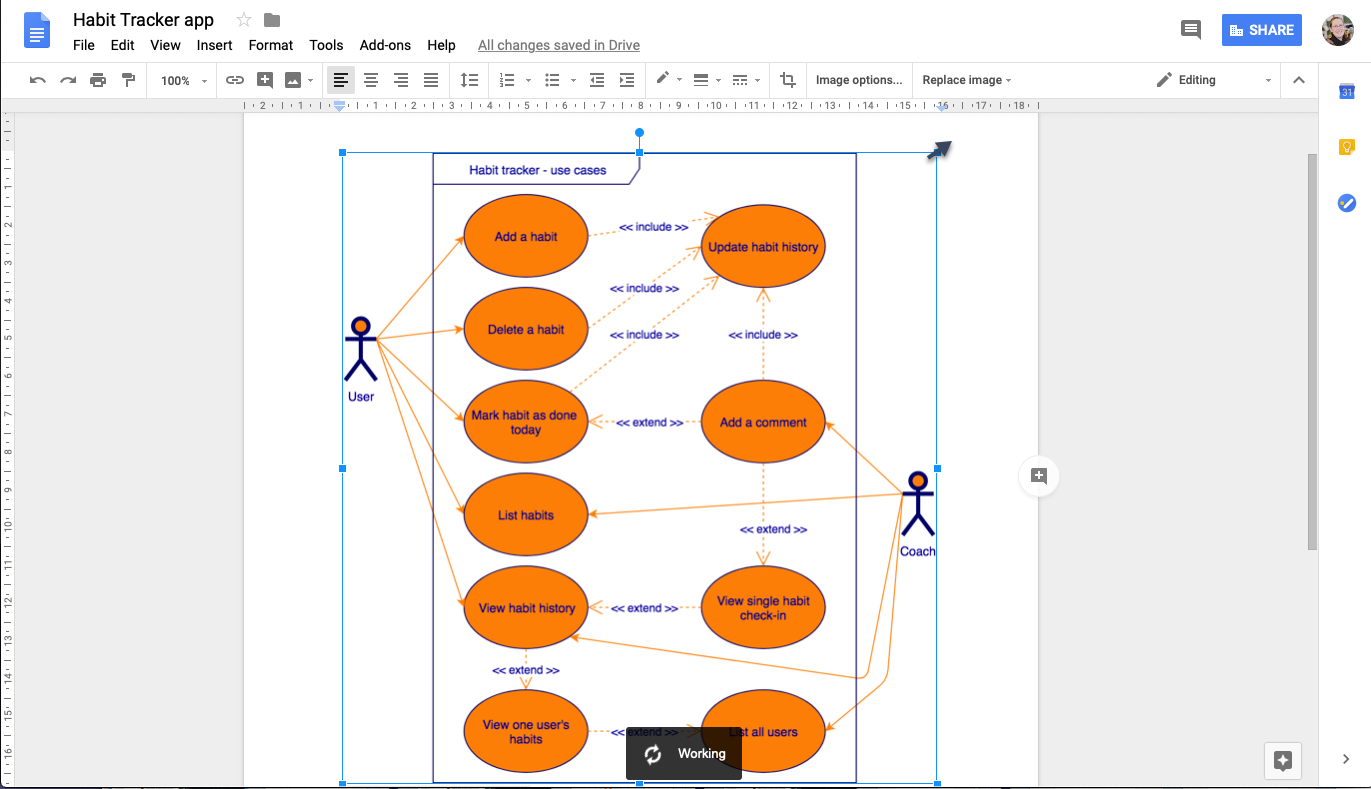
Your diagram will automatically fill the width of the page. When you select it, you can drag the corners to resize it, and drag the middle to move it to another position on the page.

Insert multiple diagrams in one step
While you can only insert one page from any single diagram into your document each time, you can select multiple diagrams to insert at once. Each of these diagrams will be automatically resized to fill the width of the page.

Work with your diagrams
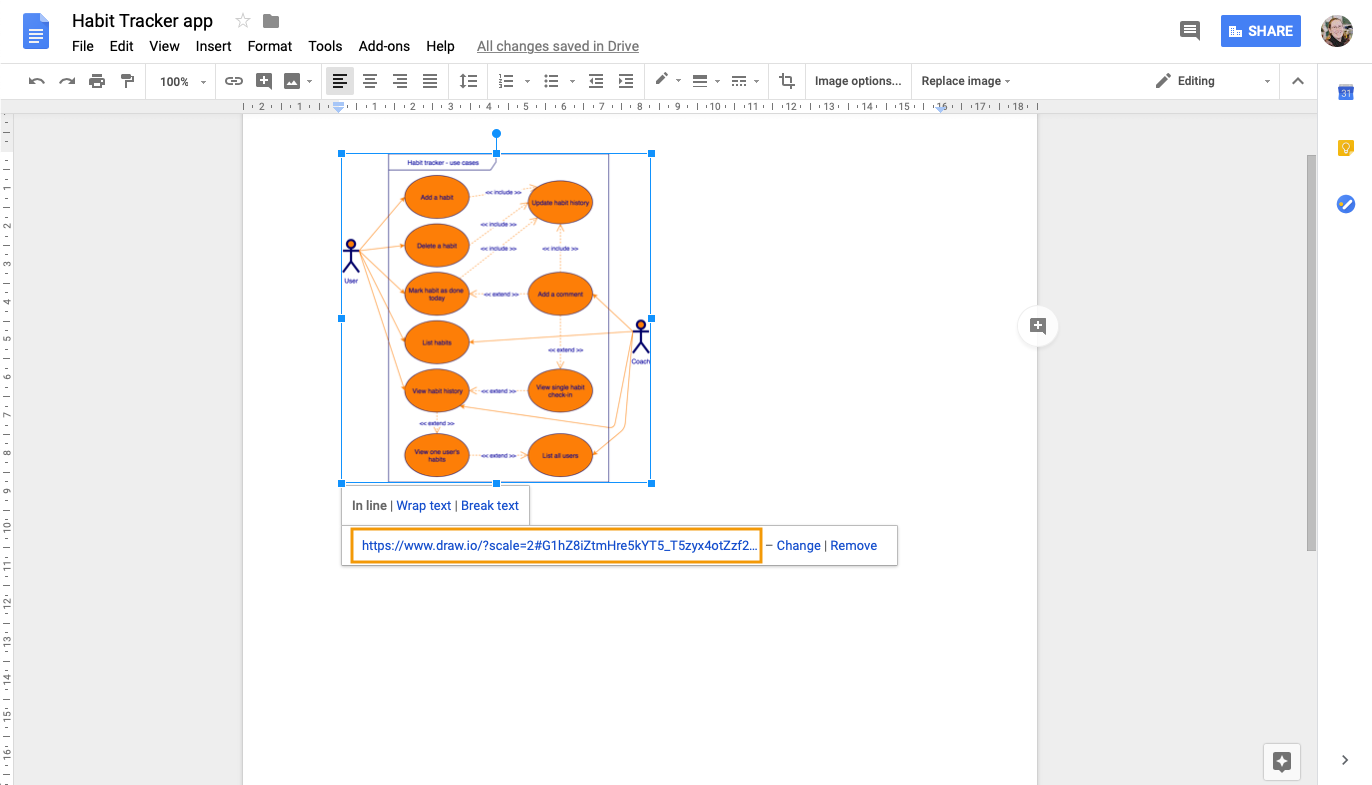
When you select your diagram in your Google document, you’ll see it was automatically linked to the draw.io diagram file.
Click on this link (usually displayed below your diagram) to open it in the draw.io editor in a new browser tab.
Be careful: Don’t remove that link or you will no longer be able to open it in draw.io from within your document or update it via the add-on menu options!
Comment on diagrams
One of the best things about Google Docs is how easy it is to collaborate with others on the one document. You can comment on the diagram in exactly the same way as commenting on text or on an image.
Select the diagram then click the Add a comment bubble on the right, or right-click and select Comment from the context menu.
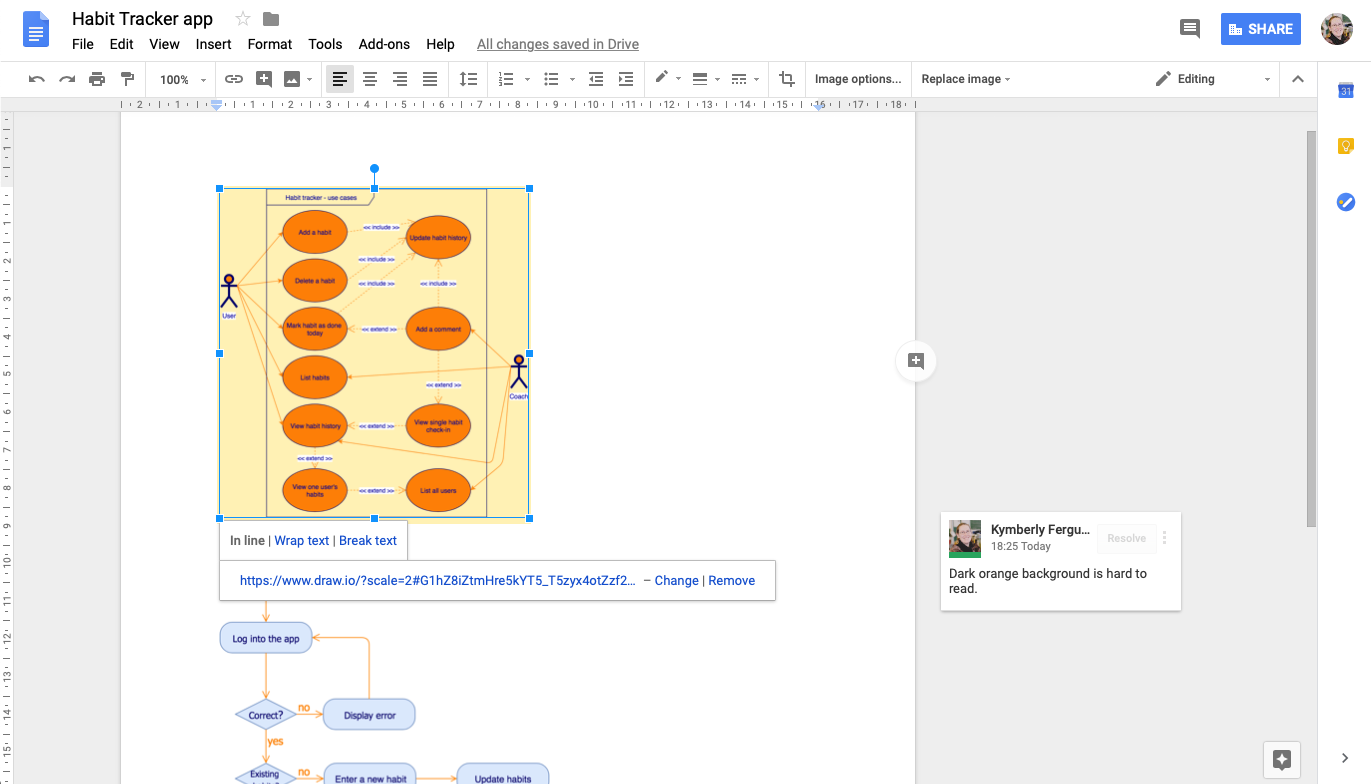
Update your diagram to see changes
When you have changed something in your diagram in the draw.io editor, you’ll need to regenerate the placeholder image of it in your document.
Select Add-ons > Draw.io Diagrams > Update Selected from the menu. After a short time, the diagram in your document will be updated with the changes you made in draw.io.
Tip: If more than one diagram has been changed, choose Update All instead.

Change how your diagram appears
There are a few editing options that you can use to change how your diagram appears in your document, without having to open it in the draw.io editor – this will not change your diagram itself.
Image options
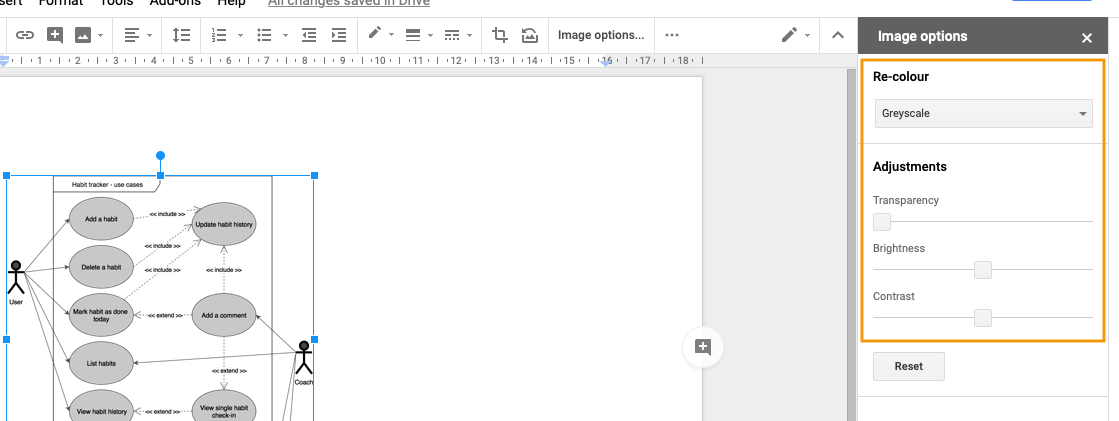
You can recolor the diagram, change its transparency, brightness or contrast within your document without changing the diagram itself by setting different image options.
Select the diagram in your document, then click Image Options in the toolbar, or right click and select Image Options from the context menu. The settings that you can change will appear in a panel on the right.
For example, you can quickly change a diagram to greyscale to make your document (and diagrams) easier and cheaper to print. Your original draw.io diagram will not be changed.
Crop your diagram
Perhaps you only need to show a part of a diagram, but don’t want to create a separate draw.io page just for that diagram section.
Double click on the diagram in your document and you will see a thick and black outline appear. Alternatively, select the diagram then click Crop image in the toolbar.
Drag this outline to include just the section of the diagram you want to display. You can drag the diagram ‘under’ the crop selector to display a different part of the diagram – it doesn’t just have to show the top left!
Comments
Post a Comment